Multiple Choice
Identify the
choice that best completes the statement or answers the question.
|
|
|
1.
|
You ask a statistical question about the 10 members of a dance team. Which
statement must be true?
a. | The average of the answers is one of the answers. | b. | All of the answers
have the same units. | c. | There are exactly 10 different
answers. | d. | There are at least 2 different answers. |
|
|
|
2.
|
Mia plants 20 flowers of different types in her garden. Which of the following
questions is NOT a statistical question about the flowers?
a. | What was the total cost of the flowers? | b. | How tall is the
shortest flower? | c. | How many of each type of flower is there? | d. | How many flowers
have 5 petals? |
|
|
|
3.
|
Find the interquartile range of the data displayed in the box plot
shown. 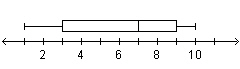
|
|
|
4.
|
Which data set does the line plot represent? 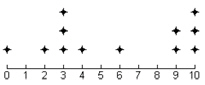 a. | 0, 2, 2, 3, 3, 4, 6, 9, 9, 9, 10, 10 | c. | 0, 2, 3, 3, 3, 4, 6, 9, 9, 10, 10,
10 | b. | 0, 2, 3, 3, 3, 3, 4, 9, 9, 10, 10, 10 | d. | 0, 2, 3, 3, 4, 4, 5, 6, 9, 9, 10,
10 |
|
|
|
5.
|
Which is the correct box-and-whisker plot for the data set? 7, 13, 9, 15, 11, 7, 11
|
|
|
6.
|
Which data set could the histogram represent? 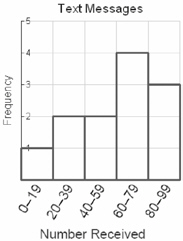 a. | 6, 21, 33, 45, 59, 68, 70, 76, 79, 82, 94, 96 | b. | 6, 21, 33, 39, 59,
68, 70, 76, 79, 82, 94, 96 | c. | 6, 21, 33, 45, 59, 68, 70, 76, 83, 85, 94,
96 | d. | 6, 12, 33, 45, 59, 68, 70, 76, 79, 82, 94, 96 |
|
|
|
7.
|
Which is the correct box-and-whisker plot for the data set? 3, 2, 11, 8, 9, 8, 7, 3, 5
|
|
|
8.
|
Which is the correct box-and-whisker plot for the data set 15, 8, 11, 5, 12, 14,
7?
|
|
|
9.
|
The number of hours a person spends reading each day is shown. What are the
minimum and maximum values on the number line that could be used to fit all of the data on a box
plot?
3, 7, 2, 1, 3, 6, 0, 5, 2, 7, 0, 4, 2, 6, 7, 2, 3, 1, 8, 4, 0, 4
a. | The minimum value is 1 and the maximum value is 7. | b. | The minimum value is
 and the maximum value is 7. and the maximum value is 7. | c. | The minimum value is 0 and the maximum value is
8. | d. | The minimum value is 1 and the maximum value is 8. |
|
|
|
10.
|
What is the value of the upper quartile in the box plot shown? 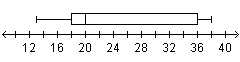
|
|
|
11.
|
The county gave these attendance figures for the last five county fairs: 18,647,
12,931, 17,213, 14,525, and 13,364. What are the units of this data?
a. | feet | c. | kilograms | b. | people | d. | degrees Celsius |
|
Multiple Response
Identify one
or more choices that best complete the statement or answer the question.
|
|
|
1.
|
Glenn wants to learn more about his classmates. Which of the following are
statistical questions that Glenn can ask?
|
|
|
2.
|
Roberto asks “How old are you?” to each of his classmates, and then
records the data he receives. Which units can Roberto use to record his data?
|
Matching
|
|
|
Using the data set shown, match the measures of center and spread with their
corresponding values. Round answers to the nearest tenth as needed.
3, 7, 9, 2, 11, 6, 13, 12, 15,
9, 3, 6, 13, 9, 10, 5 a. | 3.3 | b. | 6.0 | c. | 7.0 | d. | 8.3 | e. | 9.0 | f. | 12.0 | g. | 13.0 |
|
|
|
1.
|
Mean absolute deviation
|
|
|
2.
|
Interquartile range
|