Multiple Choice
Identify the
choice that best completes the statement or answers the question.
|
|
|
1.
|
Find the unit rate.
8 mi in 5 h
a. | 1.6 mi/h | c. | 1.5 mi/h | b. | 2.5 mi/h |
|
|
|
2.
|
Steel alloys are formed by mixing certain ratios of iron, carbon, and sometimes
other elements. The table shows the amount of carbon required to make certain amounts of a particular
alloy. Find the missing value for the table. Steel (kg) | Carbon (g) | 50 | 250 | 60 | 300 | 70 | | 80 | 400 | | |
a. | 350 g | b. | 280 g | c. | 420
g | d. | 175 g |
|
|
|
3.
|
A large lemonade container at a party holds 9 liters of lemonade. About how many
gallons of lemonade does the contain hold? Use  . a. | 0.4 gallon | b. | 2.4 gallons | c. | 12.8
gallons | d. | 34.1 gallons |
|
|
|
4.
|
What is 120% of 50?
|
|
|
5.
|
Which question is NOT a statistical question?
a. | What is the height of the Empire State Building? | b. | How did
students’ math grades change over the year? | c. | What is the average attendance for school field
hockey games? | d. | How often do middle school students eat fresh fruit every
week? |
|
|
|
6.
|
The line plot shows the number of medals won by the fifteen 6th-grade classes
that participated in a mini-Olympics. Where do most of the scores cluster? 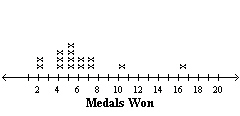 a. | around 10 | c. | around 15 | b. | at the higher end of the
range | d. | at the lower end of
the range |
|
|
|
7.
|
The number of touchdowns scored by one football team in each game during a
season is shown. What was the mean of the touchdowns the team scored during that season?
2, 4, 1,
0, 4, 3, 2, 4, 5, 1, 0, 3, 6, 4, 2, 3
a. | 2.75 touchdowns | b. | 3 touchdowns | c. | 3.14
touchdowns | d. | 4 touchdowns |
|
|
|
8.
|
If the data shown is displayed using a dot plot, how many dots would go over the
value 3?
2, 3, 7, 4, 2, 1, 3, 5, 12, 1, 10, 2, 3, 1, 3, 6, 3, 8, 9, 11, 2
|
|
|
9.
|
The number of hours a person spends reading each day is shown. What are the
minimum and maximum values on the number line that could be used to fit all of the data on a box
plot?
3, 7, 2, 1, 3, 6, 0, 5, 2, 7, 0, 4, 2, 6, 7, 2, 3, 1, 8, 4, 0, 4
a. | The minimum value is 1 and the maximum value is 7. | b. | The minimum value is
 and the maximum value is 7. and the maximum value is 7. | c. | The minimum value is 0 and the maximum value is
8. | d. | The minimum value is 1 and the maximum value is 8. |
|
|
|
10.
|
What is the value of the upper quartile in the box plot shown? 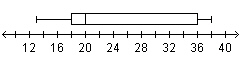
|